I have been interested in pursuing the field of Data Science ever since I was a Junior in High School and someone told me I could combine my two loves into a career, math and programming. Since then I have gone out of my way to learn and constantly be thinking about data and how it plays a part in this rapidly changing world. When working on a data science project, I am always of the philosophy that although machine learning models are powerful, they come way after an in depth understanding of the data through graphs and pure statistics. I have a very strong passion for data and see love getting my hands dirty in trying to understand the structure and patterns in the data.
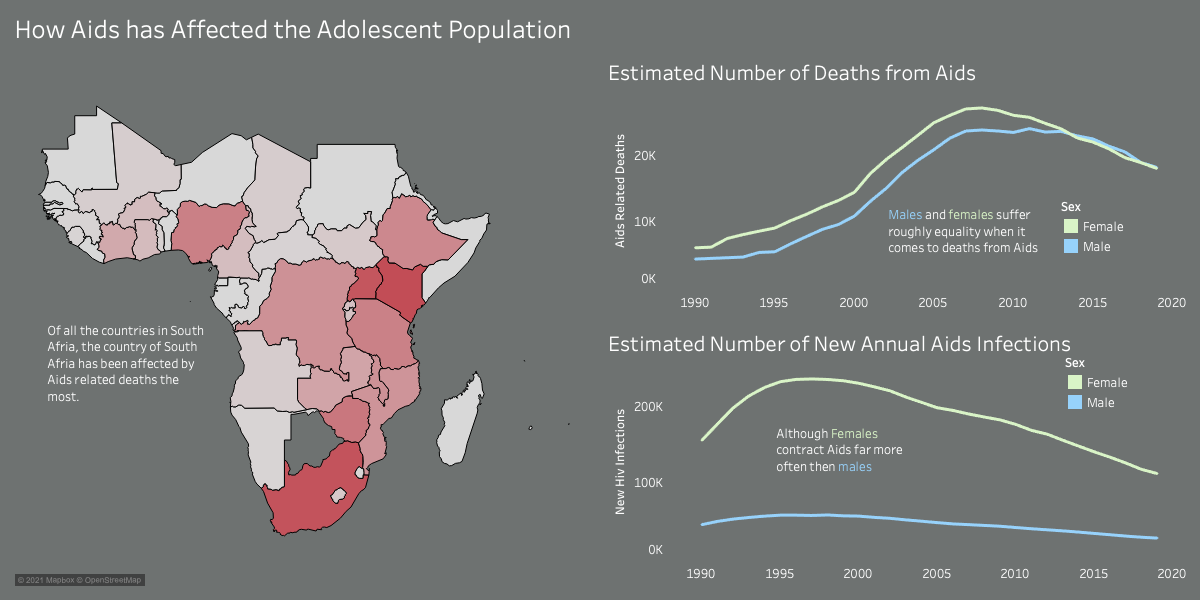
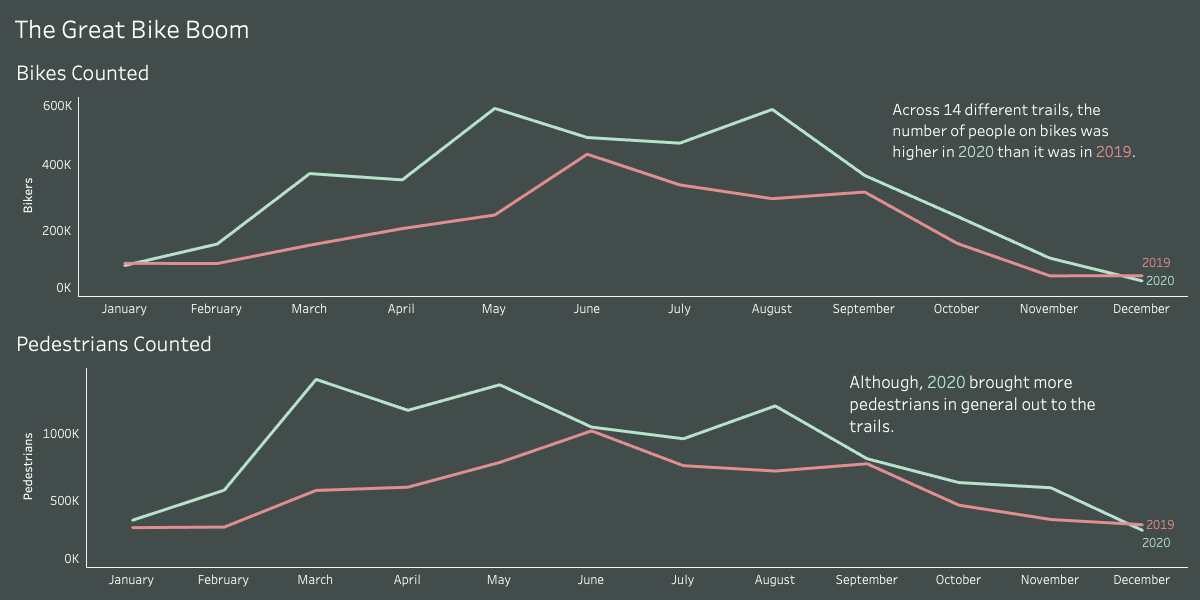
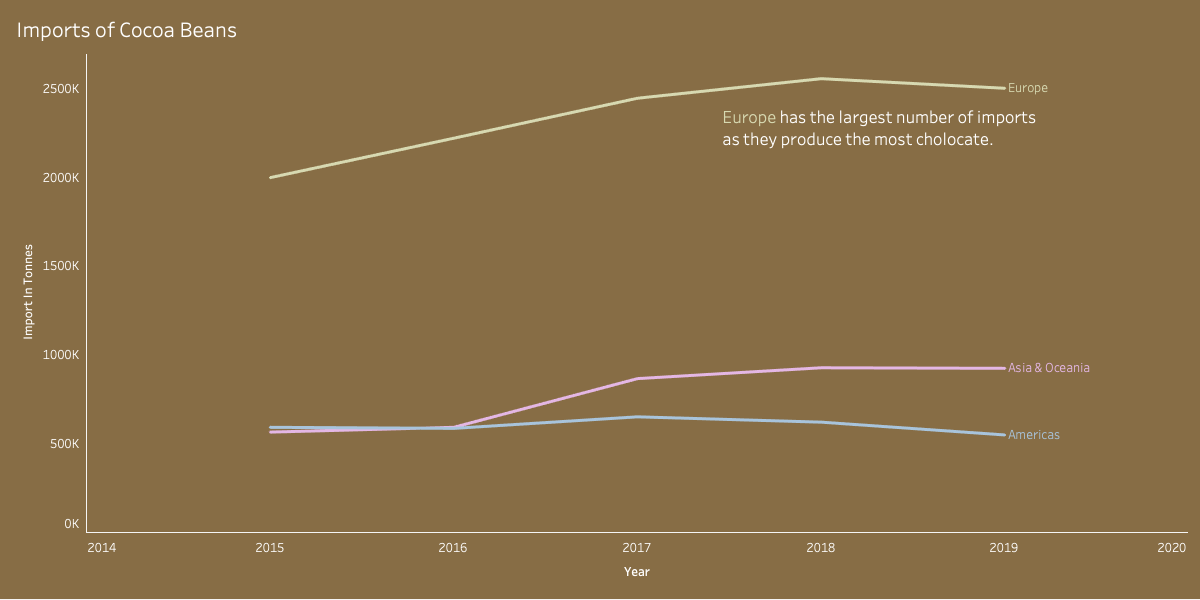
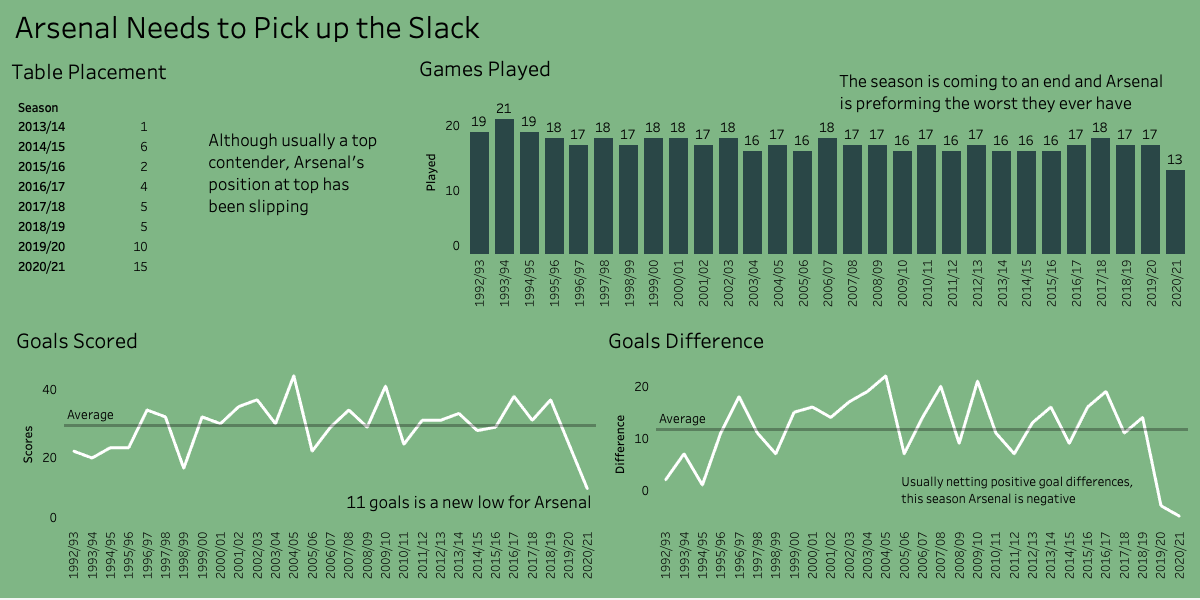
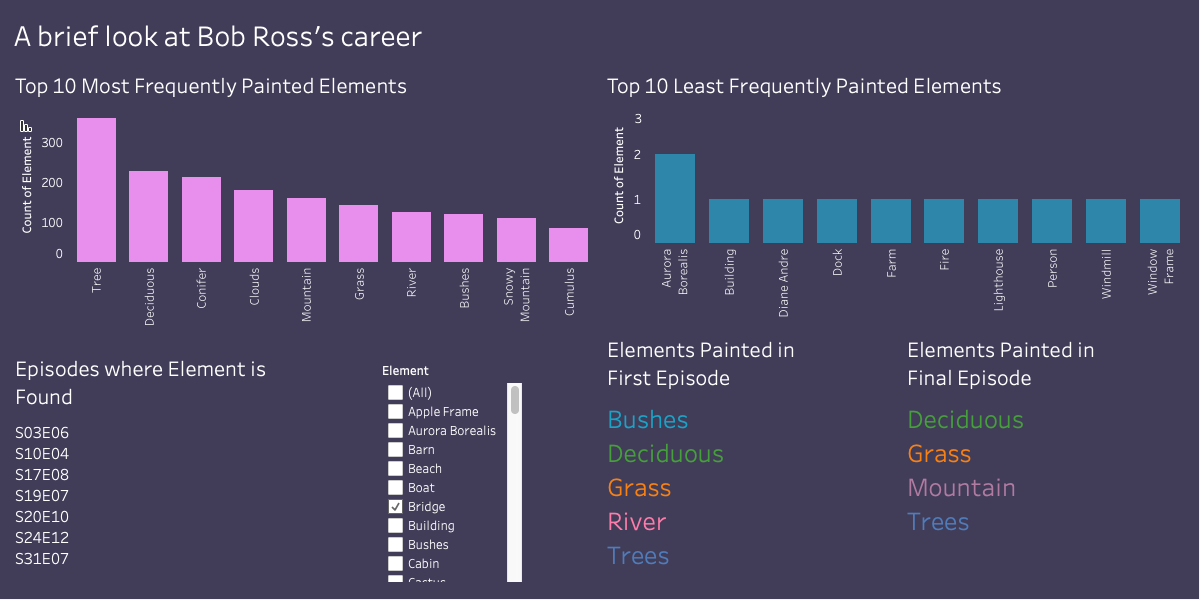
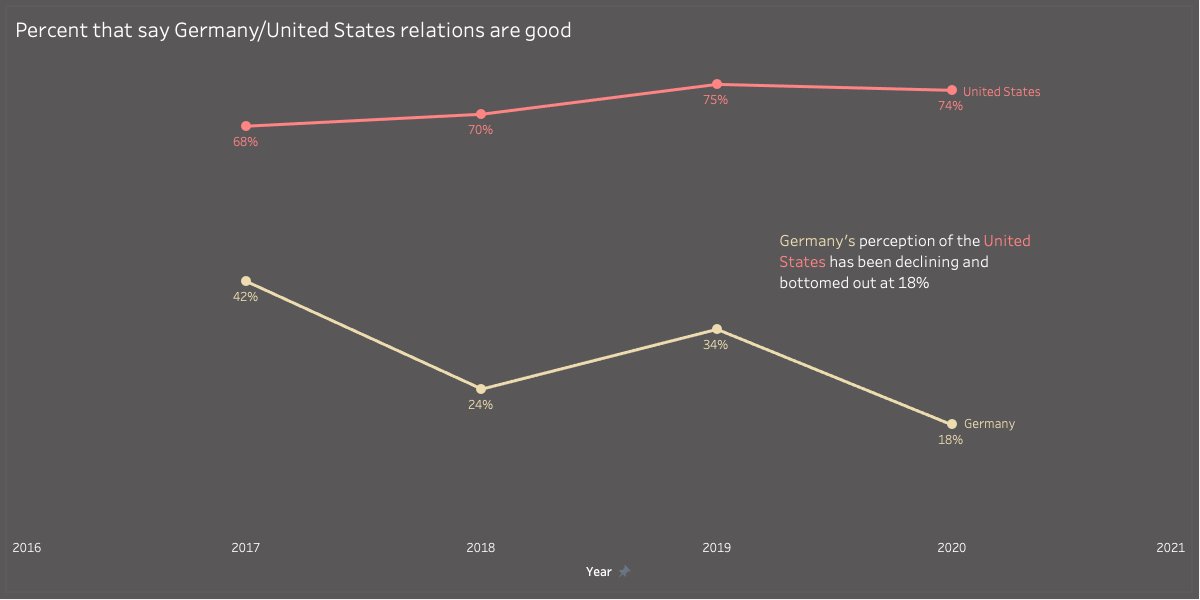
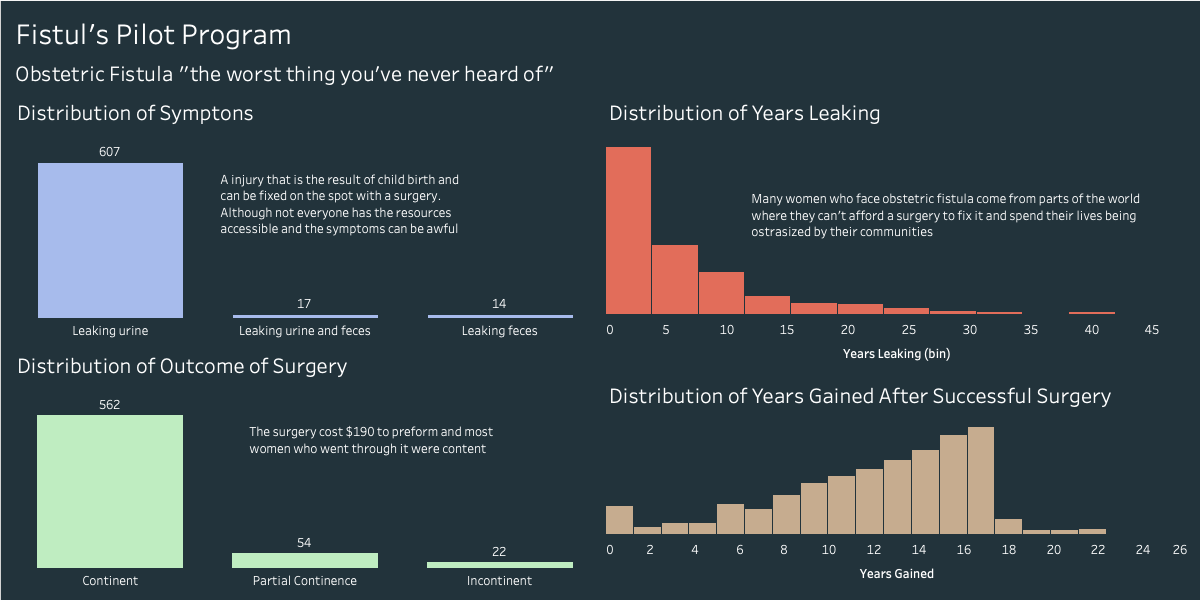
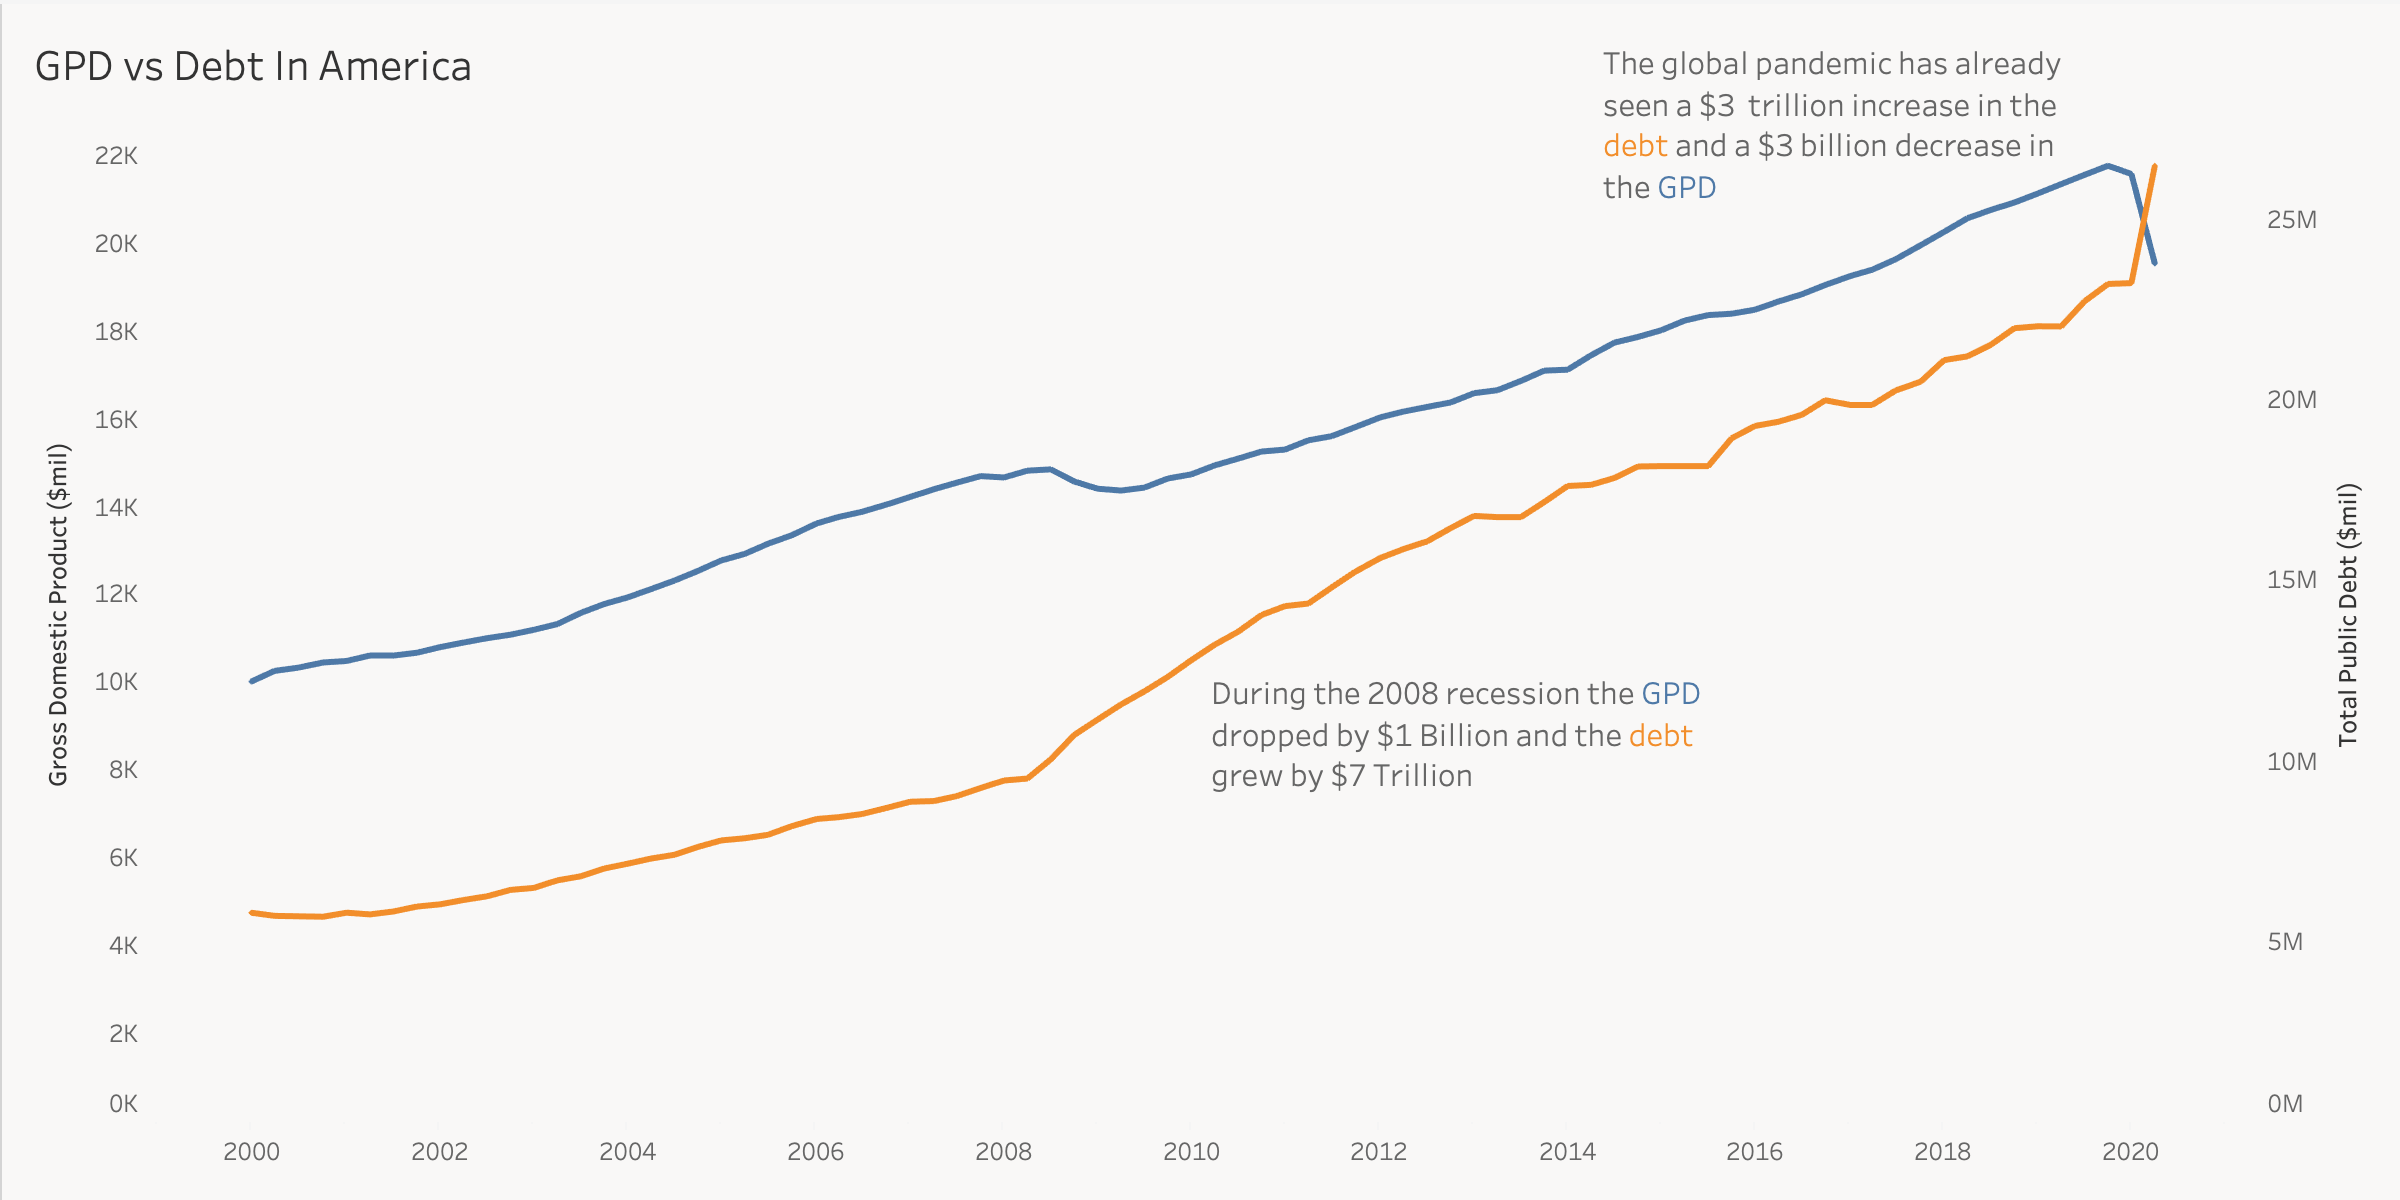
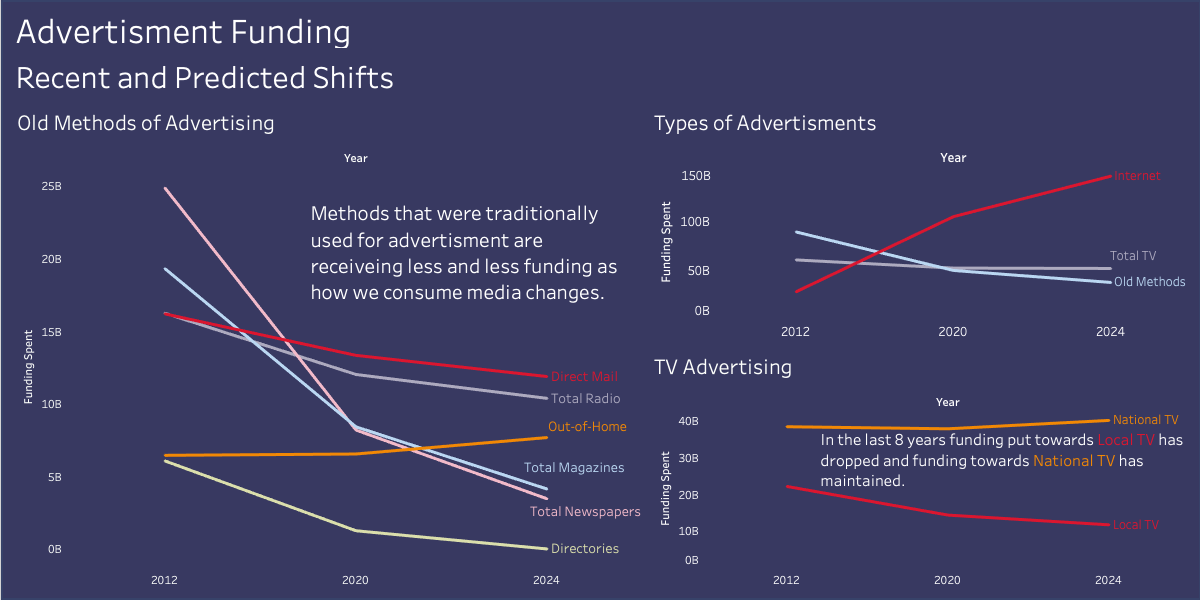
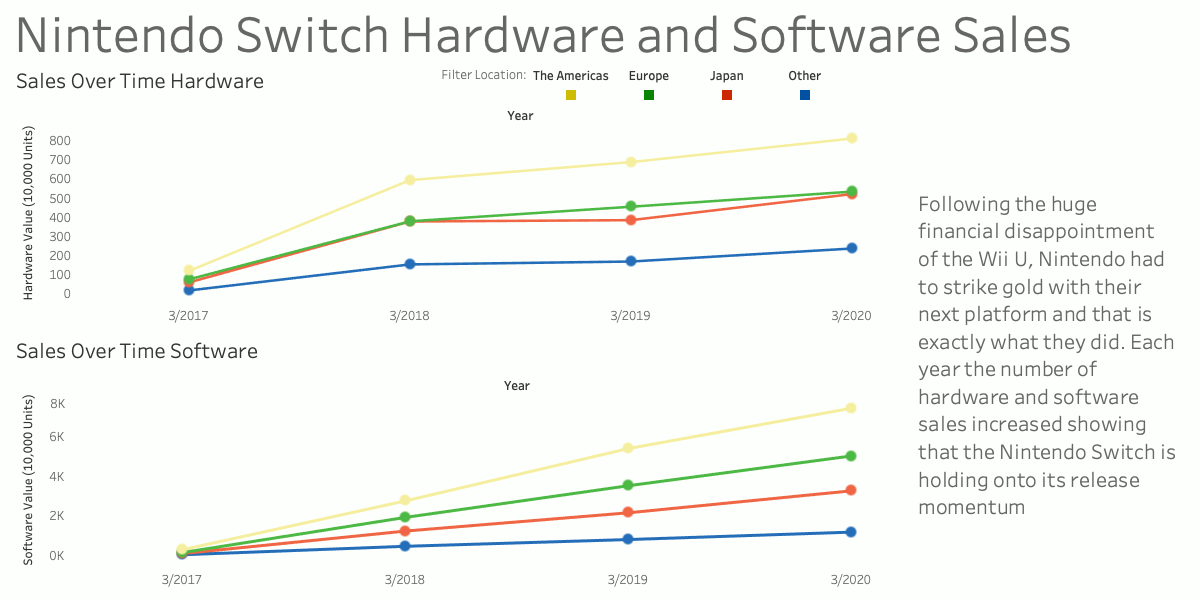
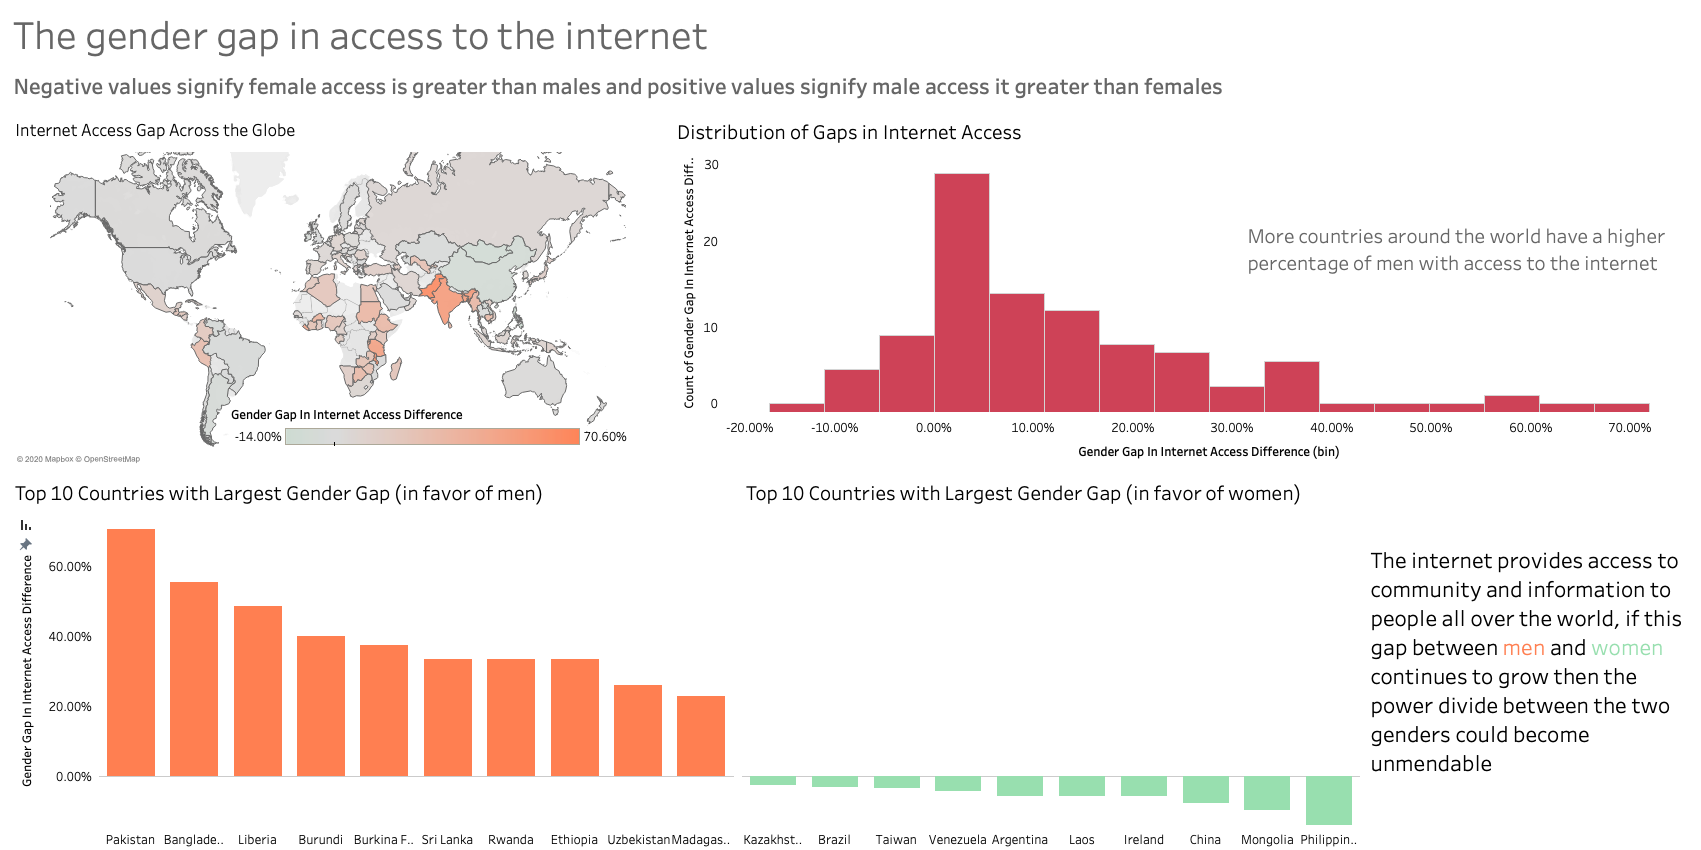
Makeover Monday is a community of people who are passionate about data visualization. Every week a data set and a visualization are posted and the community must work on a better way of representing the data. There is a place to post your visualizations and the community will comment on what you have done. I joined this community in October of 2020 as I wanted a place to practice my data visualization because one can do all the fancy statistics and machine learning models in the world, but if you can't elegantly express your results in a visual way, it is in vain. My current goal is to understand how to make visually appealing, then I will tackle creating more interactive dashboards. Due to the size of my current workload in school, I am currently taking a break, but will continue this journey once the school year ends.
For this project I worked on a small team of one other data scientist and a business advisor. The goal of the project was to use machine learning to make a prediction system to speed up the job of Lead Geniuses. We utilized a deep neural network that was trained on 75,000 data points and had an accuracy of roughly 40%. Due to the fact that this was classification with very sparse classes this is roughly the accuracy the business advisor wanted us to hit. After developing the model we worked on building a Flask API endpoint in order to reach the model from the front end. This endpoint was documented in openapi.
At WPI every student must complete an MQP as a senior to graduate. My MQP is with Dell EMC and we worked on analyzing board logs in order to predict future failures and uncover hidden reasons why past boards had been failing. We utilized data mining, feature selected, and machine learning in order to do this. Our team consisted of 4 WPI students, a WPI professor, and a team of Dell EMC engineers. This project was a great learning experience as it was a data science project that we got to plan all the way from data cleaning to model tuning. Our team used pandas on top of Python in order to clean and parse the data and we used Scikit to build the machine learning models.
This data set was just raw data and we experienced data in many different formats such as json, tables, and unstructured key value pairs. This meant that we had to program a lot of parsing tools in order to extract the patterns from the raw data. This was very exciting as we got to utilize many different data parsing techniques and some complex regex. Once we had the features extracted from the raw data we utilized many feature selection techniques, such as the Wilcoxon signed rank test, chi-squared, PCA, and Pearson correlation, in order to reduce the 300 features.
While doing a project in my Machine Learning class on COVID-19, my Professor and I noticed that there was a severe lack of any collections of data sets that had demographic data in relation to the pandemic. (travel data, weather, health care infrastructure, tourism rates) After attending Professor Yousefi's office hours to ask what direction I should take my Data Science career, he offered the opportunity of a summer internship. After writing up a project proposal I spent the summer collecting, cleaning, and architecturing this data set.
This project was a great learning experience for me as it allowed me to own and define a project from the ground up. First I researched various Government/academic resources (UN, World Health Organization, and Johns Hopkins University) that collect relevant demographic information. After finding the data sets I had to architect how I wanted the data sets to be connected then, I wrote a python script that utilizes pandas to clean and structure the data how I wanted it. From there I created a MySQL database on an academic server and hosted the data through an express API. I designed and programmed a website to call this API and allow the user to download and filter the data. After the project was finished, I uploaded the data to kaggle in hopes to have a further outreach. I hope that this data set can help the research community better understand how COVID-19 was properly handled (or not) and how to be better prepared for a situation like this in the future.
The kaggle data set can be found here.
For our final project in Statistical Learning we took the March Madness data from the previous 10 years and built models to identify "Cinderellas". (A low seeded team that performs better than expected) After feature engineering and creating an equation to describe Cinderellas-ness, we performed hierarchical cross-validation in order to avoid data snooping the final testing set. The models that were utilized were random forest, linear regression (stepwise selection), lasso regression, and neural networks. Also, we did hyper-parameter tuning in order to increase the model accuracy, such as in the random forest the number of features to pick from or the threshold on the lasso regression.
When a good friend from high school reached out to me asking if I was interested in helping with a research project, I didn't even think twice about it. Their team was working on an aerospace project and had flight data that had to be analyzed after each flight. My contribution towards the project was an R script that took in a raw CSV file and returned a graph with a line of best fit on the descent. I had to work with the team to understand how to process the data so that it could automatically tell when the descent happened. Once it knew the time period of the descent, the script would fit a linear regression then the team used the slope to tell the descent velocity and the R-squared value to tell the effectiveness of the parachute. This allowed the team to spend less time graphing and cleaning the data and more time to interpret the results. Every week I would attend the teams meeting and take suggestions on how to make the graphs more readable and useful for them.
Junior year WPI students are given the opportunity to travel abroad to complete a project to help the local communities. I was fortunate enough to be able to travel to Hangzhou China and complete a project with the Xin Foundation. The goal of our project was to help the Xin Foundation understand the stigma of mental health in China and address it with a WeChat mini program in order to educate. In order to achieve this we created a survey asking how people felt about the concept of mental health and spread it around the local college we were staying at. Building this survey was a learning experience as we got to understand that the way you ask your questions can influence the outcome, so it's important to take that into account. On top of this we had to work with local students to translate the survey and still hold the non-biasness of it. Working with the Xin foundation and the students at the college, I got to experience working in a completely different culture from my own and really began to appreciate the Chinese work culture.
Being president of my fraternity was one of the best learning experiences I have had in my life. I learned how to manage people towards a common goal of the group and what my leadership style is. I had to manage conveying information to the brotherhood while at the same time being in active communication with my superiors. (Chapter Advisor, WPI, National Chapter) There were many times that I was faced with inner brother conflicts that I was tasked with resolving. I found these the most challenging as I had to balance my relationship with the brothers and justice. I also worked with the treasurer on facing the financial crisis head on, as it had been a background problem that had been growing for years. This involved working on the balance sheet and completely re-imagining the yearly budget and dues. I found this role very fulfilling and it allowed me to gain a better understanding of my personal leadership style, which through this opportunity, I spent a lot of time refining.
During the summer of 2018, I worked in a team to rapidly prototype and develop an internal application (Blitz) for the Regional Outbound Sales teams. For Blitz I worked on full stack development, which interested me as the flow of data from the front end all the way to the database is such an elegant pipeline. I implemented the database architecture to allow the data to be filtered by the user. I also implemented roles so only specific users could see specific data points. The fast paced environment allowed me to rapidly prototype my ideas and see what worked well or not. The company also sponsored my team to visit defcon 2019 where I got to learn about cyber security from real experts. One interesting talk I attended was the AI behind deep-fakes and how this new scary technology could affect future politics and business.
I also spent some time going through the code base and documenting the coding stack and design patterns. Through this I have thought through how to keep a clean code base that is easy to maintain. I enjoyed this exercise and it allowed future employees to more easily join the code base and write clean and consistent code.
During my senior year of high school I knew that I wanted to pursue the field of data science. For my senior project I worked directly with the school administration on how their data could benefit their decision making. Due to the fact that I went to a technical high school the number of students year to year is not as easy as looking at the number of eighth graders. This is because there were 8 sending towns and 8th graders had to choose not to continue the public school track in order to go to Nashoba Tech. The school granted me data on the number of students from the sending towns year to year and I began using python to parse this data. Unfamiliar with regressions at the time, my best guess for predicting the next number in a series was taylor series, as I had just learned about that concept in AP Calculus. My model predicted that the proportion of students coming from each sending town would increase, but unfortunately that overall number of students would decrease. After further investigation I found that the student population of the sending towns was on the decrease thus they should focus on marketing in order to draw more students in.
By my junior year I knew that I wanted to do something in the field of data science as a career, so for my junior project I did research into Artificial Intelligence. First I created a maze program in Java that allowed the player to step their dot through a maze. Then I programmed a search agent to work on top of this. My first attempt was to create an agent that stepped through the maze and had a memory of where it had been and a probability that the end was in a certain direction so it could pick the best path to travel when it got to forks. The problem this agent faced was that it would go all over the map trying to decide the best path to take and never made a real decision. My next attempt was a depth-first agent, this worked extremely well and after watching it solve the maze for the first time I was filled with the feeling of accomplishment.
My first project at Biscom was querying the VeroSync databases with SQL in order to build a dashboard to tell the story of user usage. For this project I had to learn SQL and understand what a database is and how to query it. While working on this project I worked with the software engineers in order to understand the data and how to interpret it. Once I had created the charts I thought told a story I created a PowerPoint presentation and presented my findings to the President of the company and the software engineers working on VeroSync. This was my first introduction to data, and ever since I have had an affinity for data and the visualization of it.
If you would like to reach out to me please email me at bmtang@wpi.edu and you can find my resume here